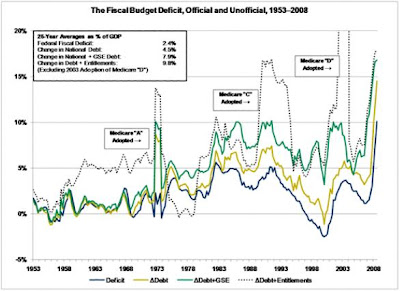
Rob Arnott from Research Affiliates wrote recently that one of the greatest problems with the US debt statistics is government accounting. In his words, "off-balance sheet spending is what got Enron executives thrown in jail, but I suppose if you write the laws while you're doing the off-balance sheet spending you can make it legal. That takes the average deficit to 4.5% of GDP over the last quarter century. 2% deficit is not a problem because GDP grows at 2% a year. 4.5% can grow out of sight...If you add-in the GSEs, the average deficit is 8% of GDP over the last quarter century. If you include unfunded entitlements, social security and medicare, you're up to a 10% average over the last quarter century."
Consider the following chart. The dark blue line traces the official fiscal deficit as a % of GDP. The gold line is the rolling 12-month change in debt as a % of GDP. Why is the gold line always above the blue line? The immediate answer is that of Rob Arnott: faulty government accounting does not include off-balance sheet entitlements.
But the fact that the change in debt is always above the deficit also has implications on the money multiplier. The growth in debt tells us what the government has actually been spending versus what the government says it has been spending. The debt tells us the real US fiscal deficit has been 10% over the last 25 years. Considering the US government has spent 10% more than its received over the last quarter century, how come our annual growth rate has only been 4-5%?
The Breaking Down of the Money Multiplier
Robert Barro of Harvard and Stanford's Hoover Institute has made studying the fiscal multiplier (or spending multiplier) his life's work. Economics textbooks will tell you that government spending is multiplied10x, because it provides income to citizens who then use that income to buy goods, which will continue to be recycled in the economy. Though economists will agree that the multiplier probably isn't as high as 10, they tend to agree that it is above 1. Robert Barro argues the fiscal multiplier is less than 1. Furthermore, he argues it has never been 1 and that it currently stands around .15 (here is his article in the WSJ arguing against the stimulus).
It seems to me that this 10% real fiscal deficit over the last 25 years strongly supports Barro's views on the fiscal multiplier. I figured before seeing this data that 2% deficits for 4% GDP growth was not a bad trade-off. I really worry about our ability to produce income in the future. According to Reinhart and Rugoff, we're reaching the point where a 1% increase in debt causes a 1% decline in GDP growth. But its more than that. Emerging markets are steadfastly following policies that will uphold their massive advantage in trade, to the detriment of their domestic population. As long as this continues, the US economy will continue to have a floor on unemployment, which pressures the government to spend. But a 10% fiscal deficit over the next 25 years is impossible.
